
Two numbers from the same survey look like they contradict each other. They do not, and the gap between them is a to-do list for your support desk.
The two numbers
Verint's State of Customer Experience 2026 asked 5,000 US consumers how they want help. 61% prefer a human agent, up 5% on the year before. Yet 69% of those same people say they would switch to automated self-service if it could fully resolve their issue. Among 18 to 34 year olds the figure is 93%.
Verint's own reading is that the preference reflects less confidence that AI will deliver, not a rejection of it. Shoppers rank a quick resolution first. Easy access to a person, when they need one, comes third.
So the question is not bot or human. It is which question goes where. Sort your tickets into three bins.
Bin 1: the question has one answer
Order status. Return window. Size chart. Last shipping day. Nobody wants a conversation about these. They want the answer, now.
Put each one on the page where the question comes up, or let automation answer it. The test is in Verint's wording: it has to resolve the issue. A bot that loops, or answers a different question, fails the test, and the shopper ends up preferring a human again.

Bin 2: the answer depends on the shopper
"Will this fit a 2019 model?" "Can you do forty units by the 15th?" The facts exist, but someone has to match them to this buyer.
Automation can take the first pass and gather the details. A person should confirm before the shopper acts on it. Hand over what the bot already collected, so the shopper does not repeat it. Verint ranks not having to repeat information after a transfer among the factors in a good experience.
Bin 3: the shopper is about to spend or leave
A first wholesale order. A basket well above your average. A complaint. Verint reports that 79% of consumers would switch to a competitor after a single terrible experience, and these are the tickets where that happens.
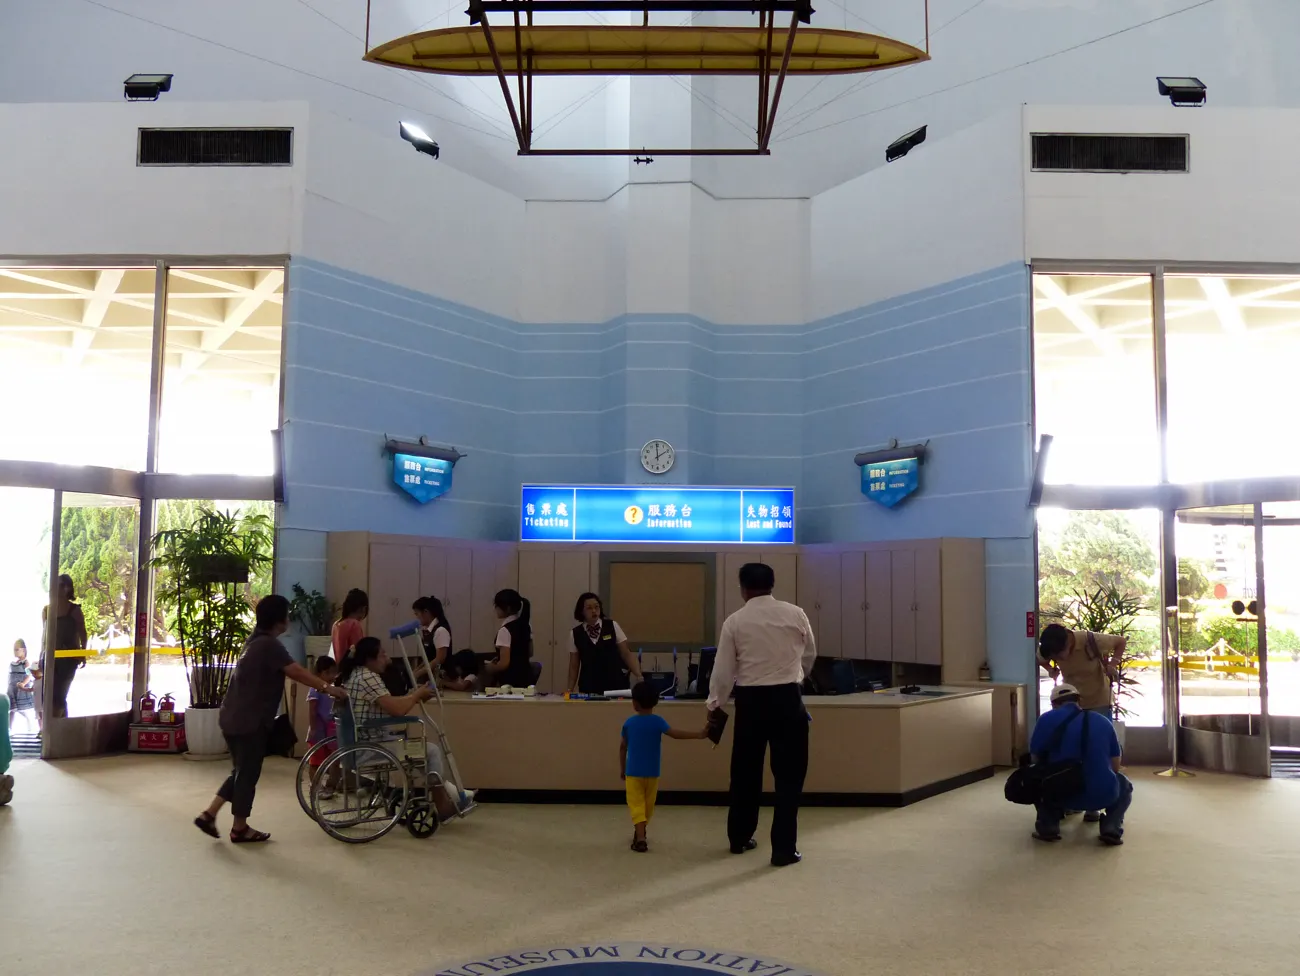
This bin should have a person in it, reachable without a form. A live call from the product page puts one there while the item is still open.
Sort one week of tickets
Pull fifty recent tickets or chat transcripts.
First, label each one bin 1, 2 or 3. Count them.
Second, take the most common bin 1 question and answer it on the page this week.
Third, for bin 3, time how long a shopper waits to reach a person. If it is longer than the shopper's patience, that is the number to fix.
Your split will not match anyone else's. Verint surveyed US consumers and sells customer experience software, and the bins are an editorial tool, not a finding from its data. The count tells you which bin your store is short of.
Source
Verint, "The State of Customer Experience 2026 Deep Dive #1: The Human Preference Paradox" (blog post of 17 June 2026 on the State of Customer Experience 2026 report; 5,000 US consumers, fieldwork dates not stated beyond early 2026; 61% prefer a human agent, up 5% on the year before; 69% of those who prefer a human would switch to automated self-service that fully resolved their issue, 93% of 18 to 34 year olds; the customer's top priority is a quick resolution and easy access to a human is third; not repeating information after a transfer ranks fourth; 79% would switch to a competitor after one terrible experience). The page is ambiguous on whether "up 5%" means points or percent, so the body repeats it as Verint words it. Verint sells customer experience software and the survey covers the US only. The three bins and the 50-ticket exercise are editorial applications, not findings. Photos: Wikimedia Commons, CC0 (closed ticket window, Rocklea Railway Station, John Robert McPherson; signpost in Newhaven, Andy Li; museum information desk, 2013).